
How to Create Custom Playwright Reports with Dynamic Charts
Generate steps from your code and include charts


You can create a custom report in Playwright. It’s useful when you want:
To publish the test results in Slack or Microsoft Teams
After each release
In a daily schedule test execution
Include additional info
Charts
Show the test in a different format. For example:
More friendly reporters for stakeholders or non-technical people.
Include some additional information like metadata or logs.
To align with the branding of the company.
Track some metrics like response time or memory usage.
To connect to third-party software
I’ve worked with custom reporters. For example, one company needed a screenshot to send to the translation team to request translation for each screen. I added some automated tests to check the accessibility of the web system, so I created some custom charts to show the errors by page or group by WCAG rule.
You can also use reporters created by the playwright community. One that I liked is the Ortoni report because it includes some charts and test execution history.

How to create a custom report with charts
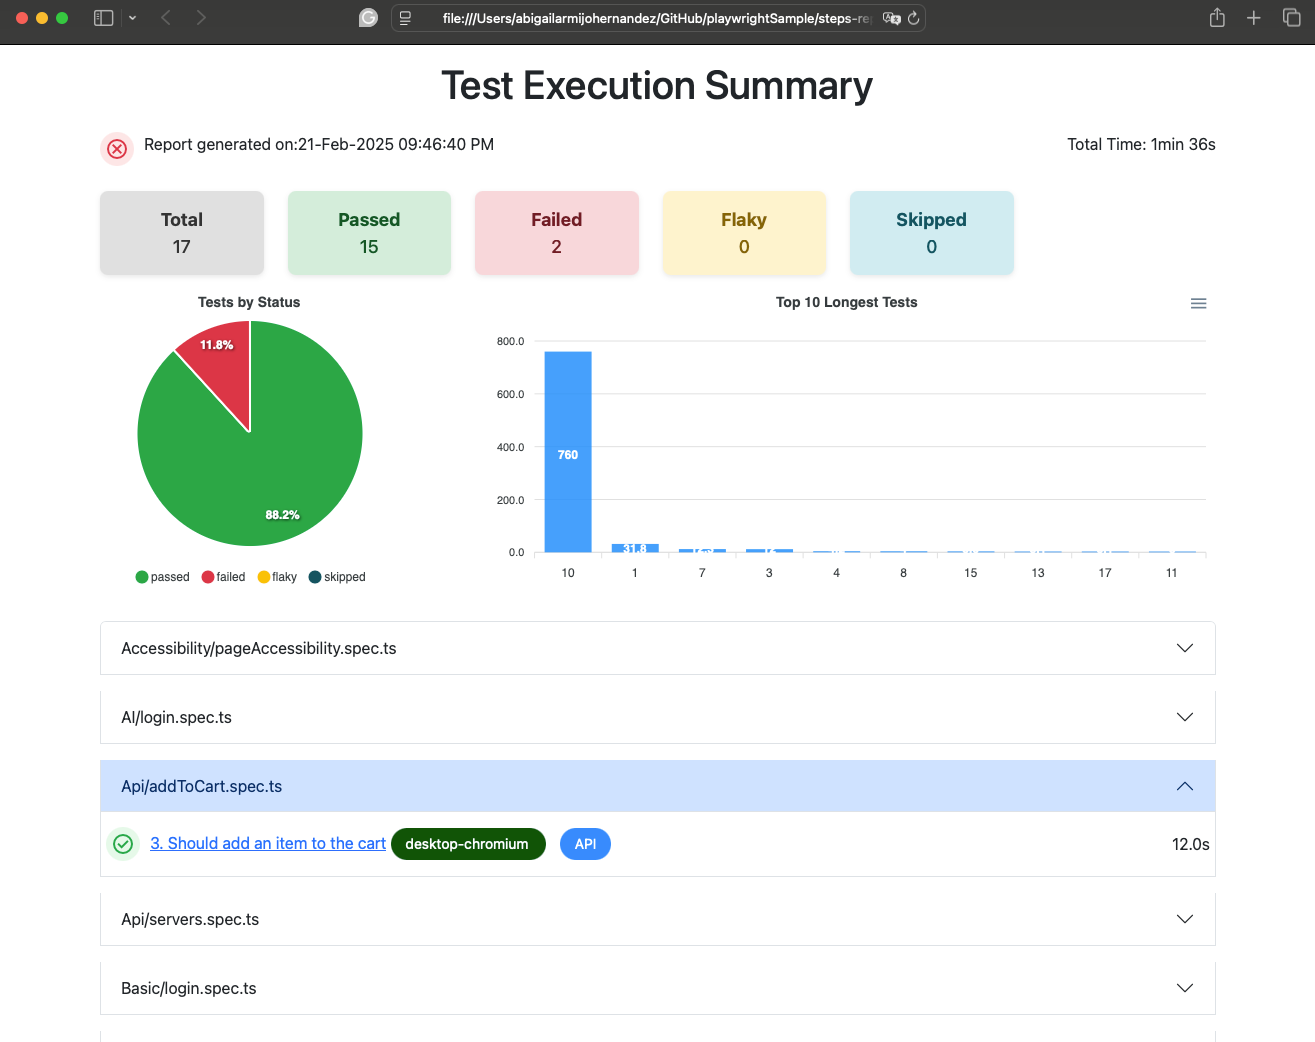
I will explain how to create a custom report for a specific case where the customer wants a report with steps that stakeholders can read without seeing any code. I added one chart to show the test summary and another to show the top 10 tests with the longest execution time.
I added the following annotation types to my tests:
Description: To add a generic description for the test
Precondition: To write the preconditions
PostCondition: To write the postconditions
GoTo: To navigate to another URL
Step: To write the step
Assert: To check some value
Mock: To mock data (replace API request with predefined values)
export enum AnnotationType {
    Precondition = 'Pre Condition',
    PostCondition = 'Post Condition',
    Description = 'Description',
    GoTo = 'Go To',
    Step = 'Step',
    Assert = 'Assert',
    Mock = 'Mock',
}
I added the annotations Description, Precondition, and Postconditions to my tests.
test.describe('Login', () => {
    test('Login with valid user load inventory page', {
        tag: ['@Basic'],
        annotation: [
            { type: AnnotationType.Description, description: 'Login with valid user on sauce demo' },
            { type: AnnotationType.Precondition, description: 'A valid username and password should exist' },
        ],
    }, async ({ page }) => {
I created a generic function to add the annotations
addAnnotation(type: AnnotationType | string, description: string) {
   test.info().annotations.push({ type: type.toString(), description: description });
}
For example, for the assert, I wrote the following:
let assertDescription = 'There is one item in the bag';
await productDetailPage.addAnnotation(AnnotationType.Assert, assertDescription)
await expect(productDetailPage.shoppingCartItem, assertDescription).toContainText('1');
I defined an interface for the report with the info I wanted to display in the test.
export interface TestResults {
    num: number,
    title: string,
    timeDuration: number,
    duration: string,
    fileName: string,
    description?: string,
    status: string,
    tags: string[],
    steps: string[],
    preConditions: string[],
    postConditions: string[],
    browser: string
    statusIcon: string,
    videoPath?: string,
    screenshotPaths?: string[],
    attachments?: { path: string, name: string }[],
    errors?: string[]
}
Finally, I added an enum with the status of the test execution and the icon with the material symbols font.
export enum TestStatusIcon {
    passed = 'check_circle',
    failed = 'cancel',
    skipped = 'skip_next',
    flaky = 'warning',
    timedOut = 'hourglass_empty'
}
I grouped my tests by filename. So, I created another interface to store the tests grouped by filename and add general stats like total duration, status, total of tests passed, failed, flaky, or skipped.
import { TestResults } from './TestResults';

export interface TestSummary {
    duration: string;
    status: string;
    statusIcon: string;
    total: number;
    totalPassed: number;
    totalFailed: number;
    totalFlaky: number;
    totalSkipped: number;
    groupedResults: Record<string, TestResults[]>
}
After I checked some template engines to replace tags in an HTML file, I started with Mustache, but because I needed some ifs conditions to, for example, don’t show the video if the playwright test didn’t generate a video, it is easier with EJS, so I changed to EJS.
EJS will replace the text between <% your_variable %> with some variables. For example, I will replace the title with the text: My title
<!DOCTYPE html>
<html>
<head>
  <meta charset="UTF-8">
  <title><%= title %></title>
</head>
<body>
  <h1><%= title %></h1>
</body>
</html>
const template = fs.readFileSync(templateFilePath, 'utf8');
const htmlContent = ejs.render(newTemplateFilePath, { title: "My title" });The EJS will create a new HTML, replacing all the tags.
<!DOCTYPE html>
<html>
<head>
  <meta charset="UTF-8">
  <title>My title</title>
</head>
<body>
  <h1>My title</h1>
</body>
</html>
I decided to create one folder with the test number for each test. For example, step-reporter/1/index.html
I created the templates with the help of Qodo, an AI tool focused on testing.
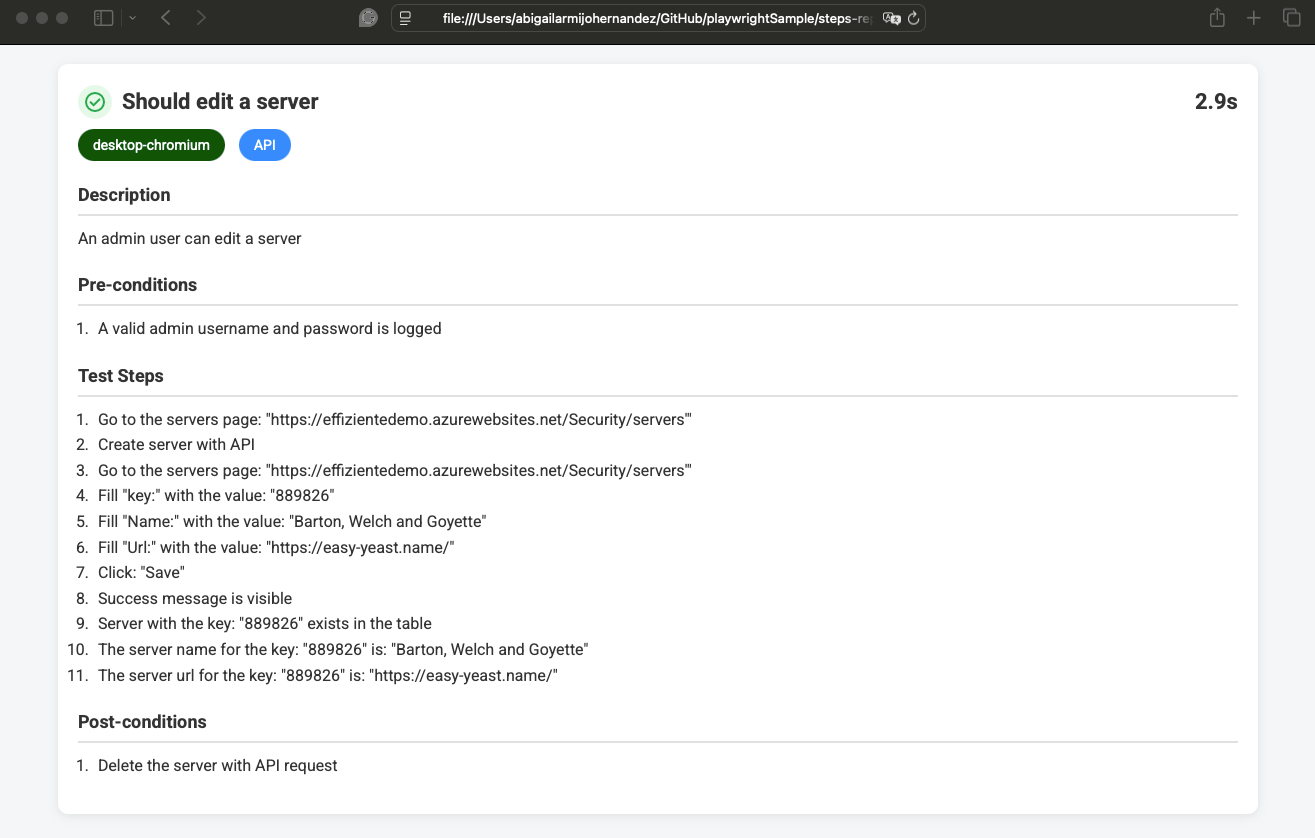
Template for one test includes:
Description
Precondition
Steps
Postconditions
Video
Attachment
Errors
<!DOCTYPE html>
<html lang="en">
<head>
  <meta charset="UTF-8" />
  <meta name="viewport" content="width=device-width, initial-scale=1.0" />
  <link rel="stylesheet"
    href="https://fonts.googleapis.com/css2?family=Material+Symbols+Outlined:opsz,wght,FILL,GRAD@20..48,100..700,0..1,-50..200" />
  <link rel="stylesheet" href="https://fonts.googleapis.com/css2?family=Roboto:wght@400;700&display=swap" />
  <title>Playwright Test Steps Report</title>
  <style>
     //Inline styles for the report
  </style>
</head>
<body>
  <div class="container">
     <div class="test">
        <header>
           <h1>
             <span class="test-details">
                <span class="status <%= result.status %>">
                  <i class="material-symbols-outlined"><%= result.statusIcon %></i>
                </span>
                <span><%= result.title %></span>
              </span>
             <span class="test-duration"><%= result.duration %></span>
           </h1>
           <div>
              <span class="chip <%= result.browser %>"><%= result.browser %></span>
              <% if(result.tags) { %>
                <span class="chip tags"><%= result.tags %></span>
              <% } %>
            </div>
          </header>
          <% if (result.description) { %>
            <section class="section">
              <h2>Description</h2>
              <p><%= result.description %></p>
            </section>
          <% } %>
          <section class="section annotations">
              <h2>Pre-conditions</h2>
              <ol>
                <% result.preConditions.forEach(function(pre) { %>
                  <li><%= pre %></li>
                <% }); %>
              </ol>
              <h2>Test Steps</h2>
              <ol>
                <% result.steps.forEach(function(step) { %>
                  <li><%= step %></li>
                <% }); %>
              </ol>
              <h2>Post-conditions</h2>
              <ol>
                <% result.postConditions.forEach(function(post) { %>
                  <li><%= post %></li>
                <% }); %>
              </ol>
            <% if (result.videoPath) { %>
              <h2>Test Video</h2>
              <video controls>
                <source src="<%= result.videoPath %>" type="video/webm" />
                Your browser does not support the video tag.
              </video>
            <% } %>
            <% if (result.screenshotPaths && result.screenshotPaths.length) { %>
              <h2>Screenshots</h2>
              <div class="screenshots">
                <% result.screenshotPaths.forEach(function(path, index) { %>
                  <img src="<%= path %>" alt="Test step screenshot <%= index + 1 %>" />
                <% }); %>
              </div>
            <% } %>
            <% if (result.attachments && result.attachments.length) { %>
              <h2>Attachments</h2>
              <ul>
                <% result.attachments.forEach(function(attachment) { %>
                  <li><a href="<%= attachment.path %>" target="_blank"><%= attachment.name %></a></li>
                <% }); %>
              </ul>
            <% } %>
          </section>
          <% if (result.errors && result.errors.length) { %>
            <section class="section">
              <h2>Errors</h2>
              <ol>
                <% result.errors.forEach(function(error) { %>
                  <li><%- error %></li>
                <% }); %>
              </ol>
            </section>
          <% } %>
        </div>
  </div>
</body>
</html>
Template for summary report. I am using apex charts, which, in my opinion, are easy to use. I included 2 charts:
Tests by status.
10 tests with the longest execution time.
<!DOCTYPE html>
<html lang="en">
<head>
  <meta charset="UTF-8">
  <meta name="viewport" content="width=device-width, initial-scale=1.0">
  <title>Test Execution Summary</title>
  <link rel="stylesheet" href="https://cdn.jsdelivr.net/npm/bootstrap@5.3.0/dist/css/bootstrap.min.css">
  <script src="https://cdn.jsdelivr.net/npm/bootstrap@5.3.0/dist/js/bootstrap.bundle.min.js"></script>
  <script src="https://cdn.jsdelivr.net/npm/apexcharts"></script>
  <link rel="stylesheet"
    href="https://fonts.googleapis.com/css2?family=Material+Symbols+Outlined:opsz,wght,FILL,GRAD@20..48,100..700,0..1,-50..200" />
  <style>
     //Inline style
  </style>
</head>
<body>
  <div class="container my-4">
    <h1 class="mb-4">Test Execution Summary</h1>
    <div class="report">
      <span class="status <%= results.status %>">
        <i class="material-symbols-outlined">
          <%= results.statusIcon %>
        </i>
      </span>
      Report generated on: <span id="currentDate"></span>
      <span class="test-duration">Total Time: <%= results.duration %>
      </span>
    </div>
    <div class="row summary-info">
      <div class="col-md-2">
        <div class="info-card info-total">
          <strong>Total</strong>
          <div><%= results.total %></div>
        </div>
      </div>
      <div class="col-md-2">
        <div class="info-card info-passed">
          <strong>Passed</strong>
          <div><%= results.totalPassed %></div>
        </div>
      </div>
      <div class="col-md-2">
        <div class="info-card info-failed">
          <strong>Failed</strong>
          <div><%= results.totalFailed %></div>
        </div>
      </div>
      <div class="col-md-2">
        <div class="info-card info-flaky">
          <strong>Flaky</strong>
          <div><%= results.totalFlaky %></div>
        </div>
      </div>
      <div class="col-md-2">
        <div class="info-card info-skipped">
          <strong>Skipped</strong>
          <div><%= results.totalSkipped %></div>
        </div>
      </div>
    </div>
    <div class="row">
      <div class="col-md-5 col-sm-6 col-lg-4">
        <div id="chart"></div>
      </div>
      <div class="col-md-7 col-sm-6 col-lg-8">
        <div id="barChart"></div>
      </div>
    </div>
    <div class="accordion mt-3" id="accordionResults">
      <% Object.keys(results.groupedResults).forEach(function(groupKey,index) { %>
        <div class="accordion-item mb-3">
          <h2 class="accordion-header" id="heading-<%= index %>">
            <button class="accordion-button" type="button" data-bs-toggle="collapse"
              data-bs-target="#collapse-<%= index %>" aria-expanded="true" aria-controls="collapse-<%= index %>">
              <%= groupKey %>
            </button>
          </h2>
          <div id="collapse-<%= index %>" class="accordion-collapse collapse show" aria-labelledby="heading-<%= index %>"
            data-bs-parent="heading-<%= index %>">
            <div class="accordion-body">
              <% results.groupedResults[groupKey].forEach(function(test) { %>
                <div class="test-row">
                  <div class="test-details">
                    <span class="status <%= test.status %>">
                      <i class="material-symbols-outlined">
                        <%= test.statusIcon %>
                      </i>
                    </span>
                    <div class="test-info">
                        <a href="./<%= index+1 %>/index.html"><%= test.num %>. <%= test.title %></a>
                        <span class="chip <%= test.browser %>">
                          <%= test.browser %>
                        </span>
                        <% if (test.tags && test.tags.length) { %>
                          <% test.tags.forEach(function(tag) { %>
                            <span class="chip tags">
                              <%= tag %>
                            </span>
                          <% }); %>
                        <% } %>
                    </div>
                  </div>
                  <div class="test-duration">
                    <%= test.duration %>
                  </div>
                </div>
                <% }); %>
                  </tbody>
               </table>
            </div>
          </div>
        </div>
        <% }); %>
    </div>
    <script>
      // Calculate counts for each status
      var statusCounts = {};
      statusCounts['passed'] = <%= results.totalPassed %>;
      statusCounts['failed'] = <%= results.totalFailed %>;
      statusCounts['flaky'] = <%= results.totalFlaky %>;
      statusCounts['skipped'] = <%= results.totalSkipped %>;
      var pieColors = ["#28a745", "#dc3545", "#ffc107", "#0c5460"];

      // Prepare data for ApexCharts
      var options = {
        chart: {
          type: 'pie',
          width: '300px',
          height: '300px'
        },
        series: Object.values(statusCounts),
        labels: Object.keys(statusCounts),
        colors: pieColors,
        title: {
          text: 'Tests by Status',
          align: 'center'
        },
        legend: {
          position: 'bottom'
        }
      };

      // Render the chart into the container with id "chart"
      var chart = new ApexCharts(document.querySelector("#chart"), options);
      chart.render();

      function formatDate(date) {
        const day = String(date.getDate()).padStart(2, '0');
        const monthNames = ["Jan", "Feb", "Mar", "Apr", "May", "Jun", "Jul", "Aug", "Sep", "Oct", "Nov", "Dec"];
        const month = monthNames[date.getMonth()];
        const year = date.getFullYear();
        let hours = date.getHours();
        const ampm = hours >= 12 ? 'PM' : 'AM';
        hours = hours % 12;
        if (hours === 0) hours = 12;
        const formattedHours = String(hours).padStart(2, '0');
        const minutes = String(date.getMinutes()).padStart(2, '0');
        const seconds = String(date.getSeconds()).padStart(2, '0');
        return `${day}-${month}-${year} ${formattedHours}:${minutes}:${seconds} ${ampm}`;
      }

      // Set the current date in the designated element
      document.getElementById("currentDate").textContent = formatDate(new Date());

      var allTests = [];
      <% Object.keys(results.groupedResults).forEach(function(groupKey) { %>
        <% results.groupedResults[groupKey].forEach(function(test) { %>
          allTests.push({
            title: "<%= test.num %>",
            duration: parseFloat("<%= test.duration %>")
          });
        <% }); %>
      <% }); %>

      // Sort tests by descending duration and select top 10
      allTests.sort(function(a, b) {
        return b.duration - a.duration;
      });
      var topTests = allTests.slice(0, 10);

      // Prepare data for ApexCharts - Bar Chart for top 10 longest tests
      var barChartOptions = {
        chart: {
          type: 'bar',
          height: 300,
        },
        series: [{
          name: 'Duration',
          data: topTests.map(function(test) {
            return test.duration;
          })
        }],
        xaxis: {
          categories: topTests.map(function(test) {
            return test.title;
          }),
          labels: {
            rotate: -45,
            style: {
              fontSize: '12px'
            }
          }
        },
        title: {
          text: 'Top 10 Longest Tests',
          align: 'center'
        }
      };
      // Render the Bar Chart into the container with id "barChart"
      var barChart = new ApexCharts(document.querySelector("#barChart"), barChartOptions);
      barChart.render();
    </script>
</body>

</html>
I created a file helper to replace the HTML tags; if I decide to change EJS to another template engine in the future, I only need to change this class.
import * as fs from 'fs';
import * as path from 'path';
import * as ejs from 'ejs';

export class HtmlHelper {
     async replaceTags(templateFile: string, objectToReplace: any, folderTest: string, fileName: string) {
        const templatePath = path.join(__dirname, 'reporter', 'templates', templateFile);
        const template = fs.readFileSync(templatePath, 'utf8');
        const htmlContent = ejs.render(template, objectToReplace);
        if (!fs.existsSync(folderTest)) {
            fs.mkdirSync(folderTest, { recursive: true });
        }
        fs.writeFileSync(fileName, htmlContent);
    }
After I created my custom reporter class with the next methods:
class StepReporter implements Reporter
{
    onBegin(config: FullConfig) {
        //Called once before running tests. I will check the testdir on the playwright.config.ts
    }

    async onTestEnd(test: TestCase, result: TestResult) {
        //When each test is executed. I am generating one html for each test
    }

    async onEnd(result: FullResult)
    {
       //When all tests are executed. I generate the summary report.
    }
}
First, I need the folder that contains all the tests to get the Id of the tests. It’s the folder that contains the test and the test name (Basic/login.spec.ts)
import { FullConfig, FullResult, Reporter, TestCase, TestResult } from '@playwright/test/reporter';

class StepReporter implements Reporter {

    private testDir = 'tests';

    onBegin(config: FullConfig) {
        // Get the testDir from playwright.config.ts or default to test.
        this.testDir = config?.rootDir || 'tests';
    }
After onTestEnd I set the object TestSummary to replace the EJS tags
async onTestEnd(test: TestCase, result: TestResult) {
    this.testNo++;
    const folderTest = path.join("steps-report", this.testNo.toString());
    const groupKey = path.relative(this.testDir, test.location.file);

    // Ensure an array exists for this group
    if (!this.summary.groupedResults[groupKey]) {
        this.summary.groupedResults[groupKey] = [];
    }
    //Remove the @on the test tag
    const tags = test.tags.map(tag => tag.replace('@', '')) ?? [];

    //Get the icon for each status
    const statusIcon = TestStatusIcon[result.status as keyof typeof TestStatusIcon];

    //Get the test stpes discard precondition, postcondition, description and a11y errors
    const steps = test.annotations.filter(annotation =>
       annotation.type != AnnotationType.Precondition
       && annotation.type != AnnotationType.PostCondition
       && annotation.type != AnnotationType.Description
       && annotation.type != 'A11y')
            .map(annotation => annotation.description ?? 'No steps');

    //Get the preconditions
    const preConditions = test.annotations.filter(annotation => annotation.type == AnnotationType.Precondition)
            .map(annotation => annotation.description ?? 'No pre conditions');

    //Get the postconditions
    const postConditions = test.annotations.filter(annotation => annotation.type == AnnotationType.PostCondition)
            .map(annotation => annotation.description ?? 'No post conditions');

    //Get the description
    const descriptionAnnotation = test.annotations.find(annotation => annotation.type == AnnotationType.Description);
        const description = descriptionAnnotation?.description ?? 'No Description';

     //Get the browser name
    const browser = test.parent.project()?.name ?? 'No browser';

    //Get the attachments discard screenshot, video and allure attacments
    const attachments: { path: string, name: string }[] = result.attachments
            .filter(attachment => attachment.name !== 'screenshot' && attachment.name !== 'video' && !attachment.name.toLowerCase().includes('allure'))
            .map(attachment => ({ path: attachment.path ?? '', name: attachment.name ?? '' })) ?? [];

   //Copy the attachments to the folder with the custom report
   const reportAttachments = attachments.map(attachment => ({
            path: this.fileHelper.copyFileToResults(folderTest, attachment.path),
            name: attachment.name
        }));

    //Copy the video
    const videoPath = this.fileHelper.copyVideo(result, folderTest);

    //Copy the screenshots
    const screenshotPaths = this.fileHelper.copyScreenshots(result, folderTest);

    // Get the errors
    const errors = result.errors.map(error => this.htmlHelper.ansiToHtml(error.message ?? 'No errors')) ?? [];

    const formattedDuration = this.timeHelper.formatDuration(result.duration);

    const resultItem: TestResults = {
        num: this.testNo,
        title: test.title,
        fileName: groupKey,
        timeDuration: result.duration,
        duration: formattedDuration,
        description: description,
        status: result.status,
        browser: browser,
        tags: tags,
        preConditions: preConditions,
        steps: steps,
        postConditions: postConditions,
        statusIcon: statusIcon,
        videoPath: videoPath,
        screenshotPaths: screenshotPaths,
        attachments: copiedAttachments,
        errors: errors
    };

    //Add to the summary by filename
    this.summary.groupedResults[groupKey].push(resultItem);
    const wasRetried = test.results && test.results.length > 1;
    const isFlaky = wasRetried && result.status === 'passed';
    if (isFlaky)
       this.summary.totalFlaky++;

    switch (result.status) {
        case 'passed':
           this.summary.totalPassed++;
           break;
        case 'failed':
           this.summary.totalFailed++;
           break;
        case 'skipped':
           this.summary.totalSkipped++;
           break;
     }

     this.summary.total++;
     const fileName = 'index.html';
     const testFilePath = path.join(folderTest, fileName);
     await this.htmlHelper.replaceTags('stepReporter.html', { result: resultItem }, folderTest, testFilePath);
}
Finally, on the onEnd that is executed at the end of all tests, I replaced the EJS tags for the dashboard.html
async onEnd(result: FullResult) {
    const folderTest = this.fileHelper.folderResults;
    const summaryName = 'summary.html';
    const summaryPath = path.join(folderTest, summaryName);
    this.summary.duration = this.timeHelper.formatDuration(result.duration);
    this.summary.status = result.status;
    const statusIcon = TestStatusIcon[result.status as keyof typeof TestStatusIcon];
    this.summary.statusIcon = statusIcon;
    await this.htmlHelper.replaceTags('summary.html', { results: this.summary }, folderTest, summaryPath);
}
You can check the complete code in my PlaywrightSample GitHub repository.
Thank you for reading, and feel free to suggest a topic for a new article and share if you think it is useful. Enjoy testing!!